
To kick off the new year, we’re excited to welcome special guest Justin Sidhu from J.P. Morgan for a Guide to the Markets session on January 25th at 4 PM Pacific via Zoom.
After a year like 2022, we know many of you have questions about what’s ahead—both the opportunities and challenges. Justin represents a company deeply rooted in economic research and market analysis, and he’ll be sharing timely insights that you won’t want to miss.
About our speaker:
Justin Sidhu is an Executive Director and Client Advisor at J.P. Morgan Asset Management. Since joining in 2005, he has worked in the independent broker-dealer channel, focusing on mutual fund and ETF sales in the Pacific Northwest. His expertise and extensive resources help support our team and clients at Ross Financial.
Join us for this insightful discussion!
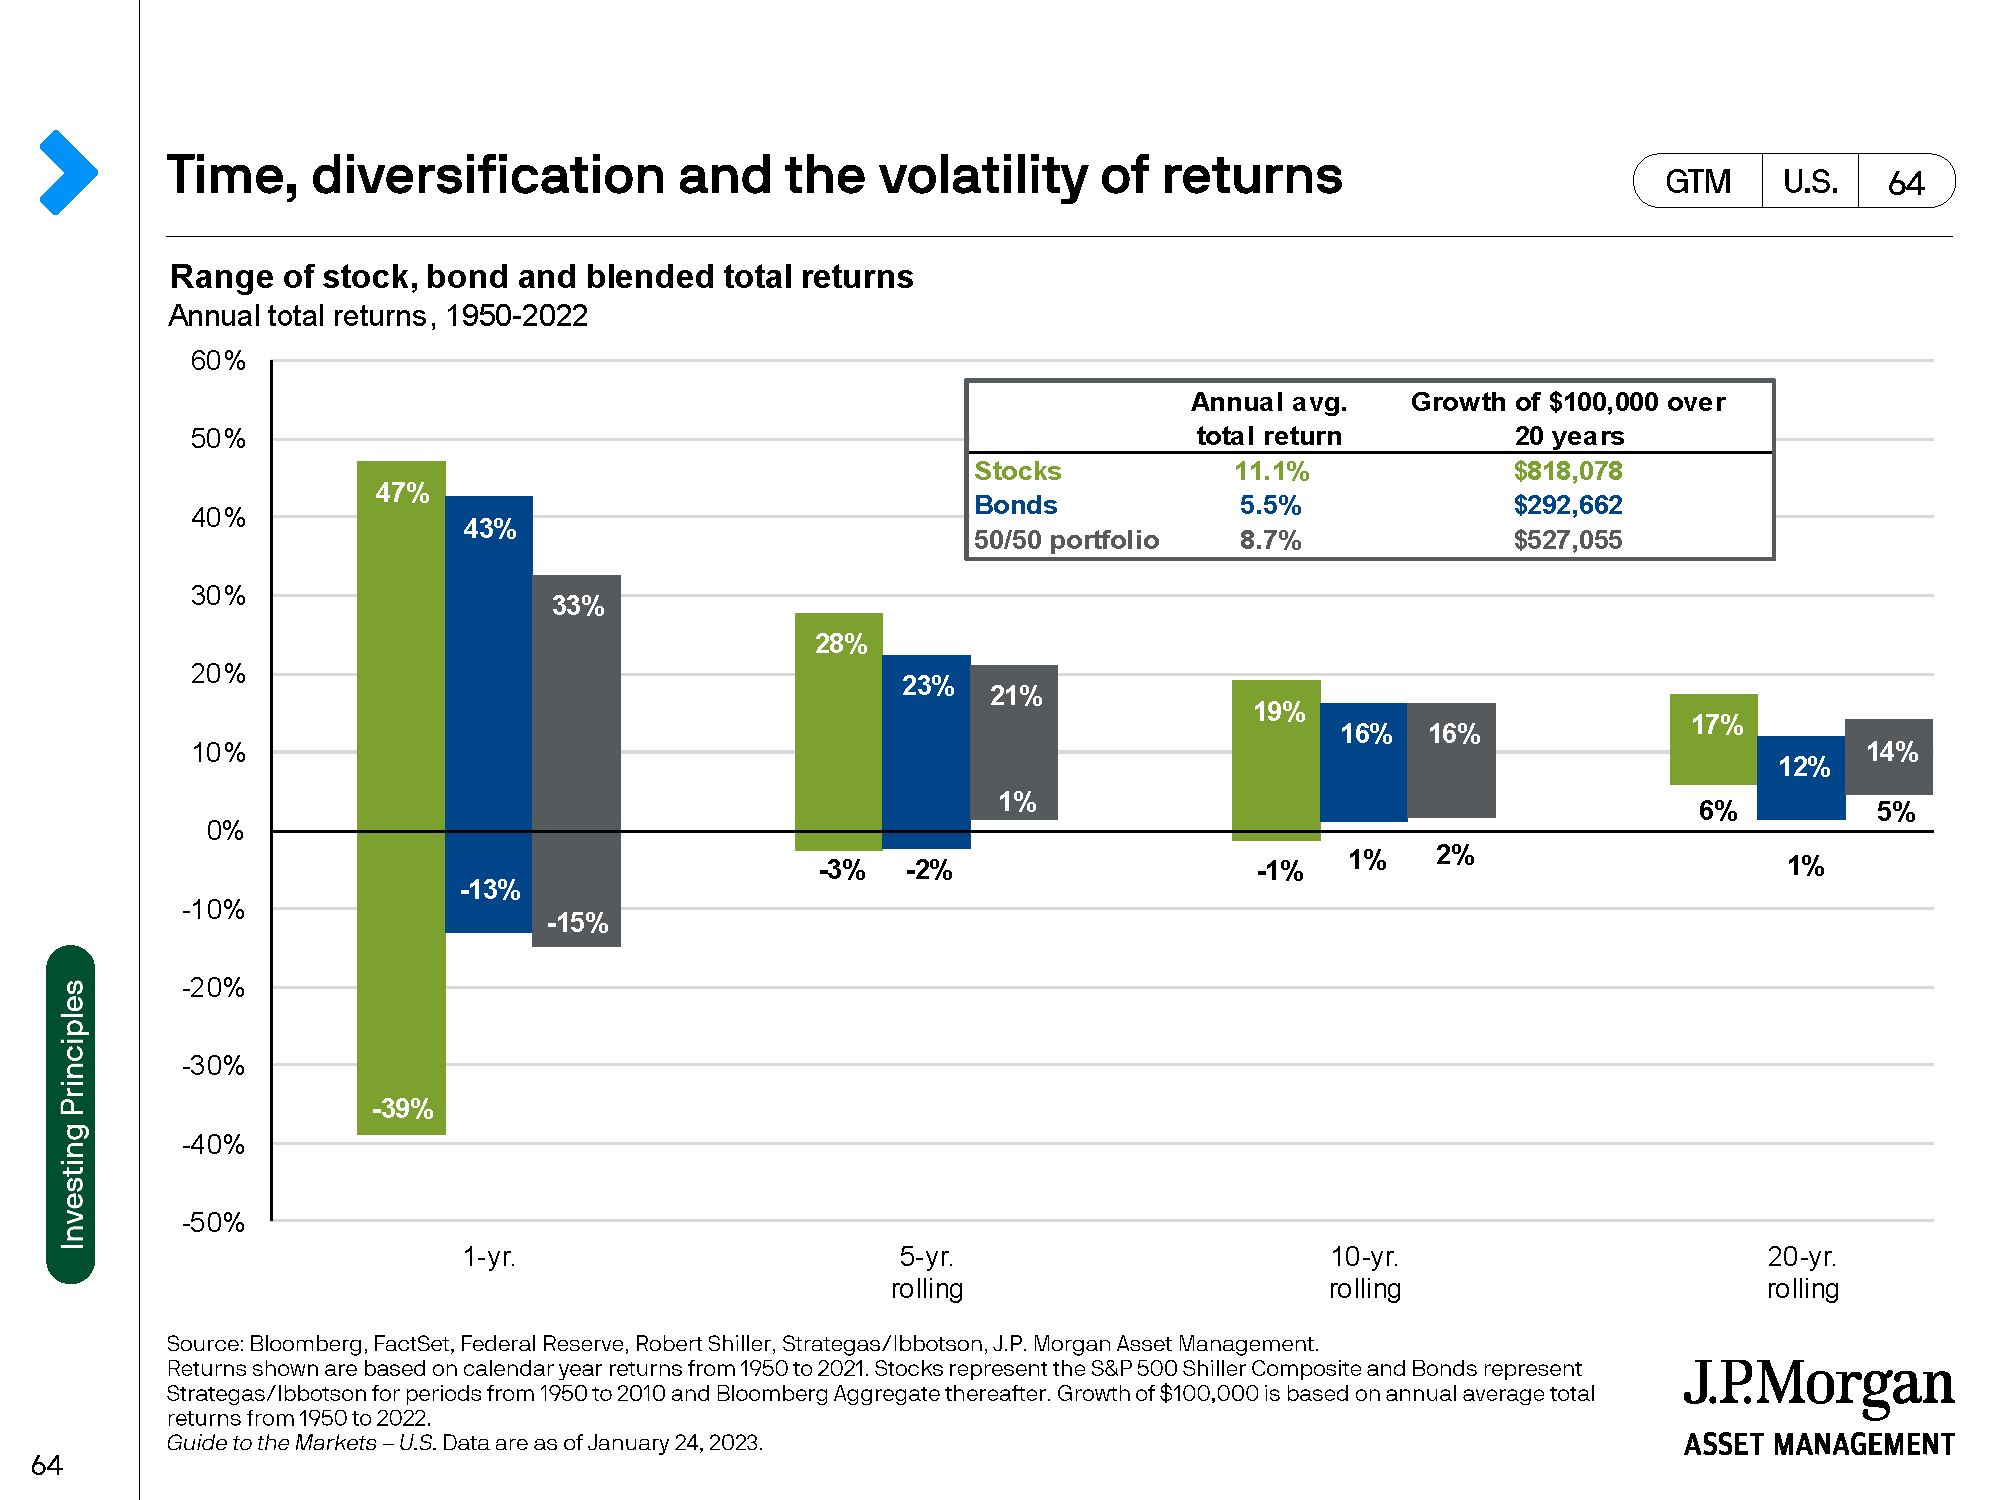
Slide 1 – Cover Slide
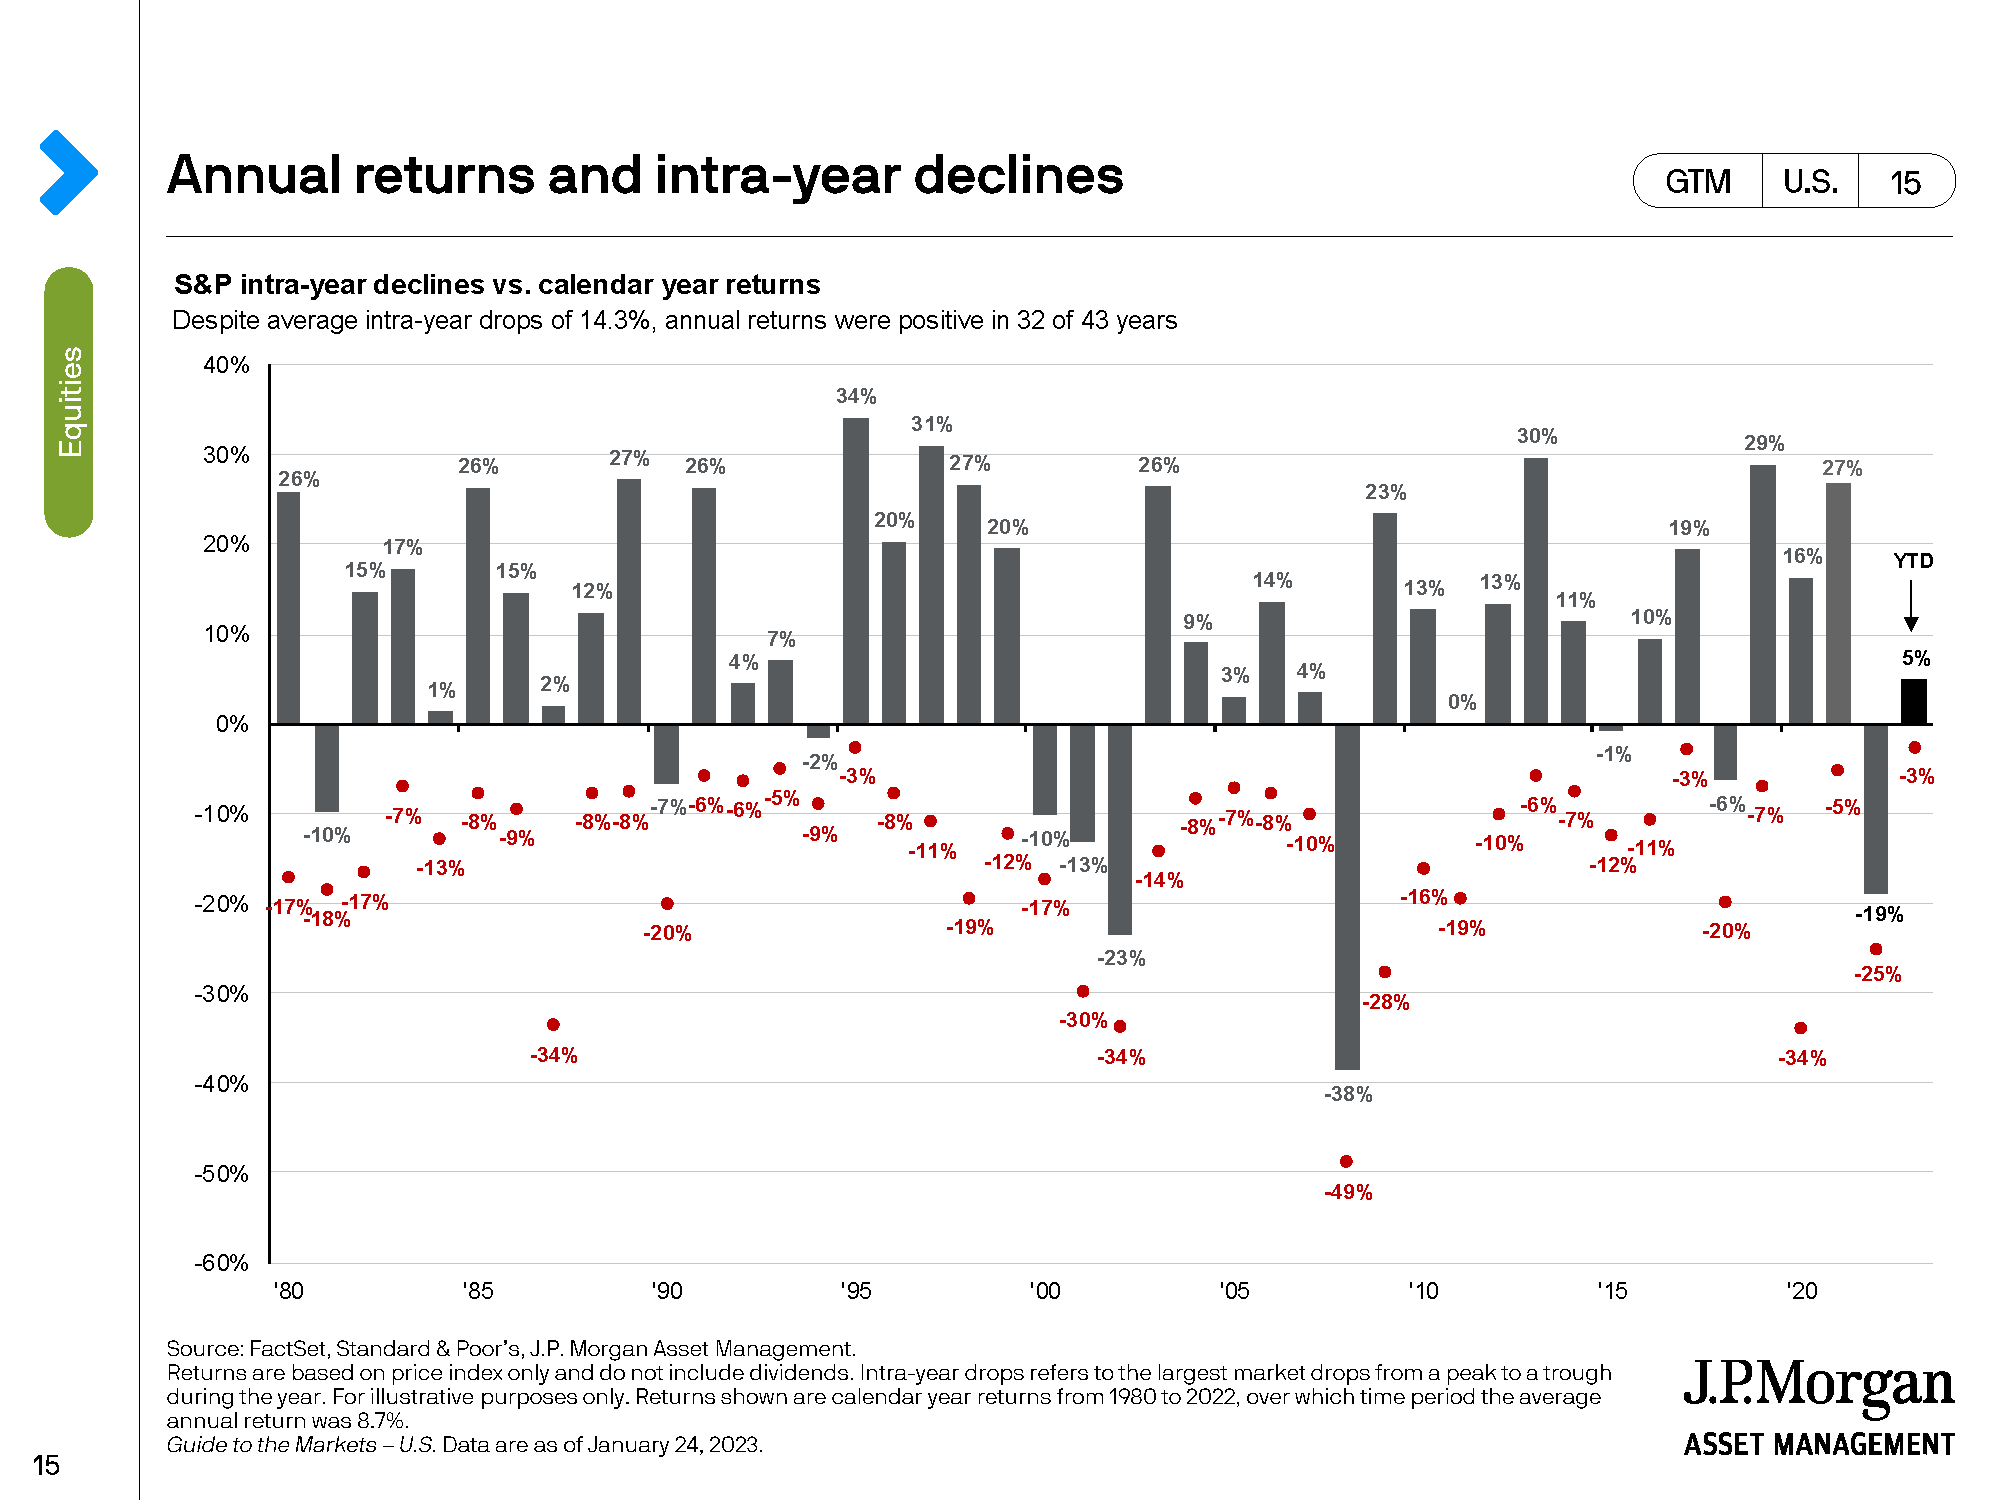
The key takeaway: every year, the market experiences an average decline of about -15%, regardless of whether the year ends positive or negative. This is normal market behavior, and historically, the market has recovered and delivered positive returns 75% of the time, with an average annual return of 8.7% over the last 42 years.
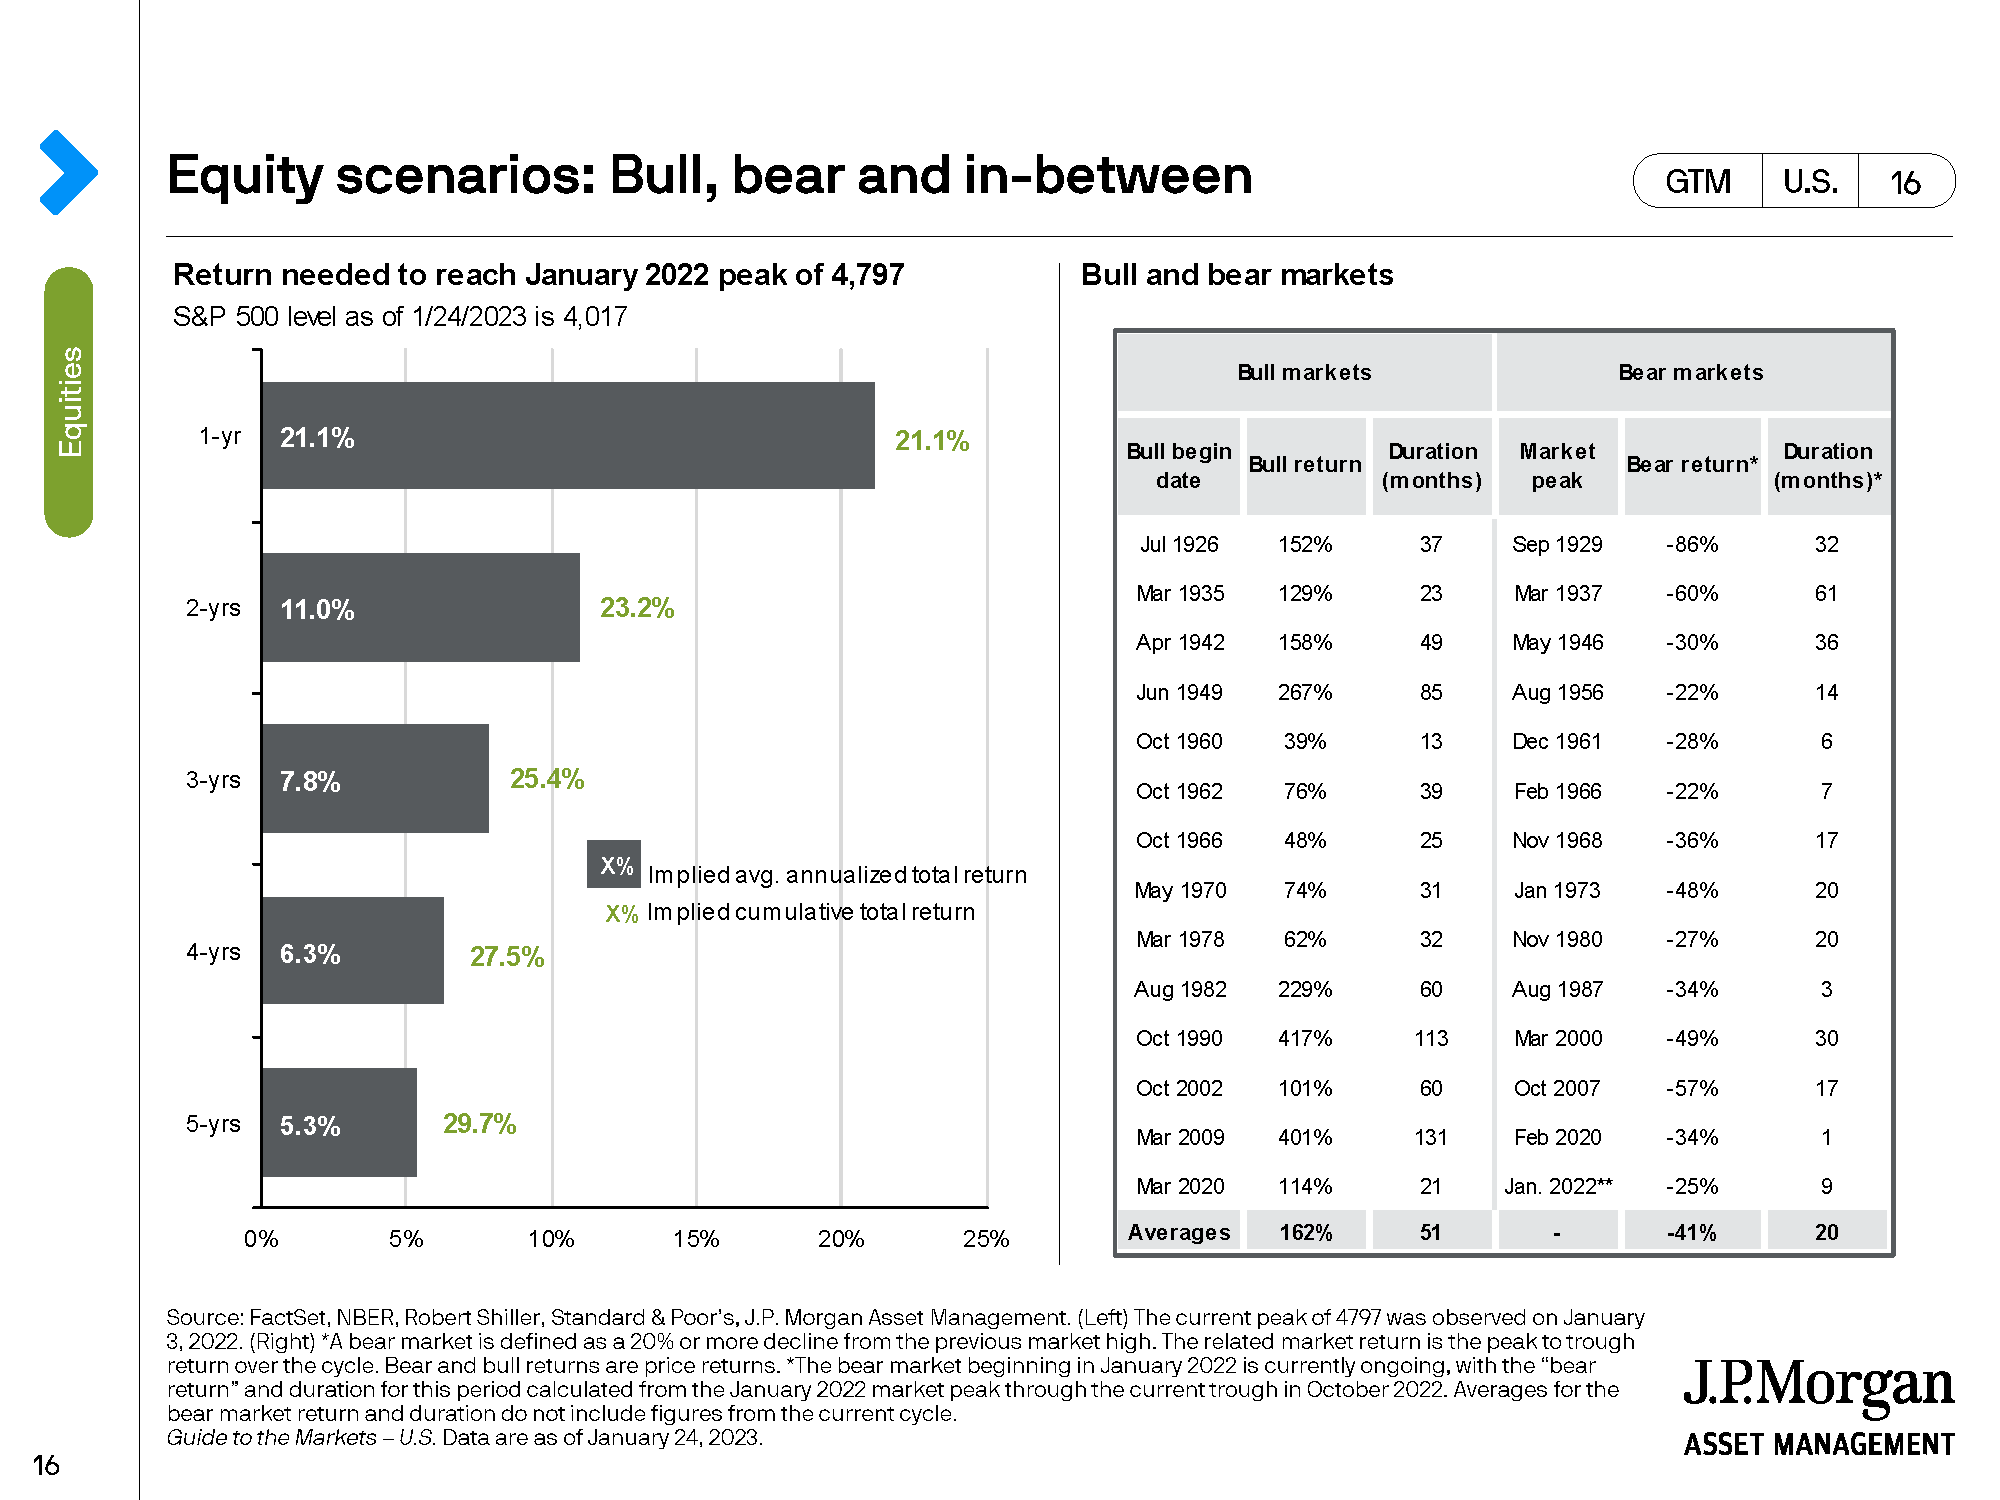
Slide 2 – Expected Recovery from 2022
On the left, we see that based on expected returns, we can anticipate how long it might take for the market to recover from last year’s negative performance. This illustrates why moving entirely to safety isn’t recommended—future growth is needed to recover prior losses. On the right, historical bull and bear markets show that average bull markets outperform bear markets, emphasizing the importance of staying invested.
Slide 3 – Intra-Year Stock Market Volatility
This slide depicts intra-year volatility in the stock market, showing that short-term declines are normal and expected. Understanding this helps investors avoid overreacting to temporary drops.
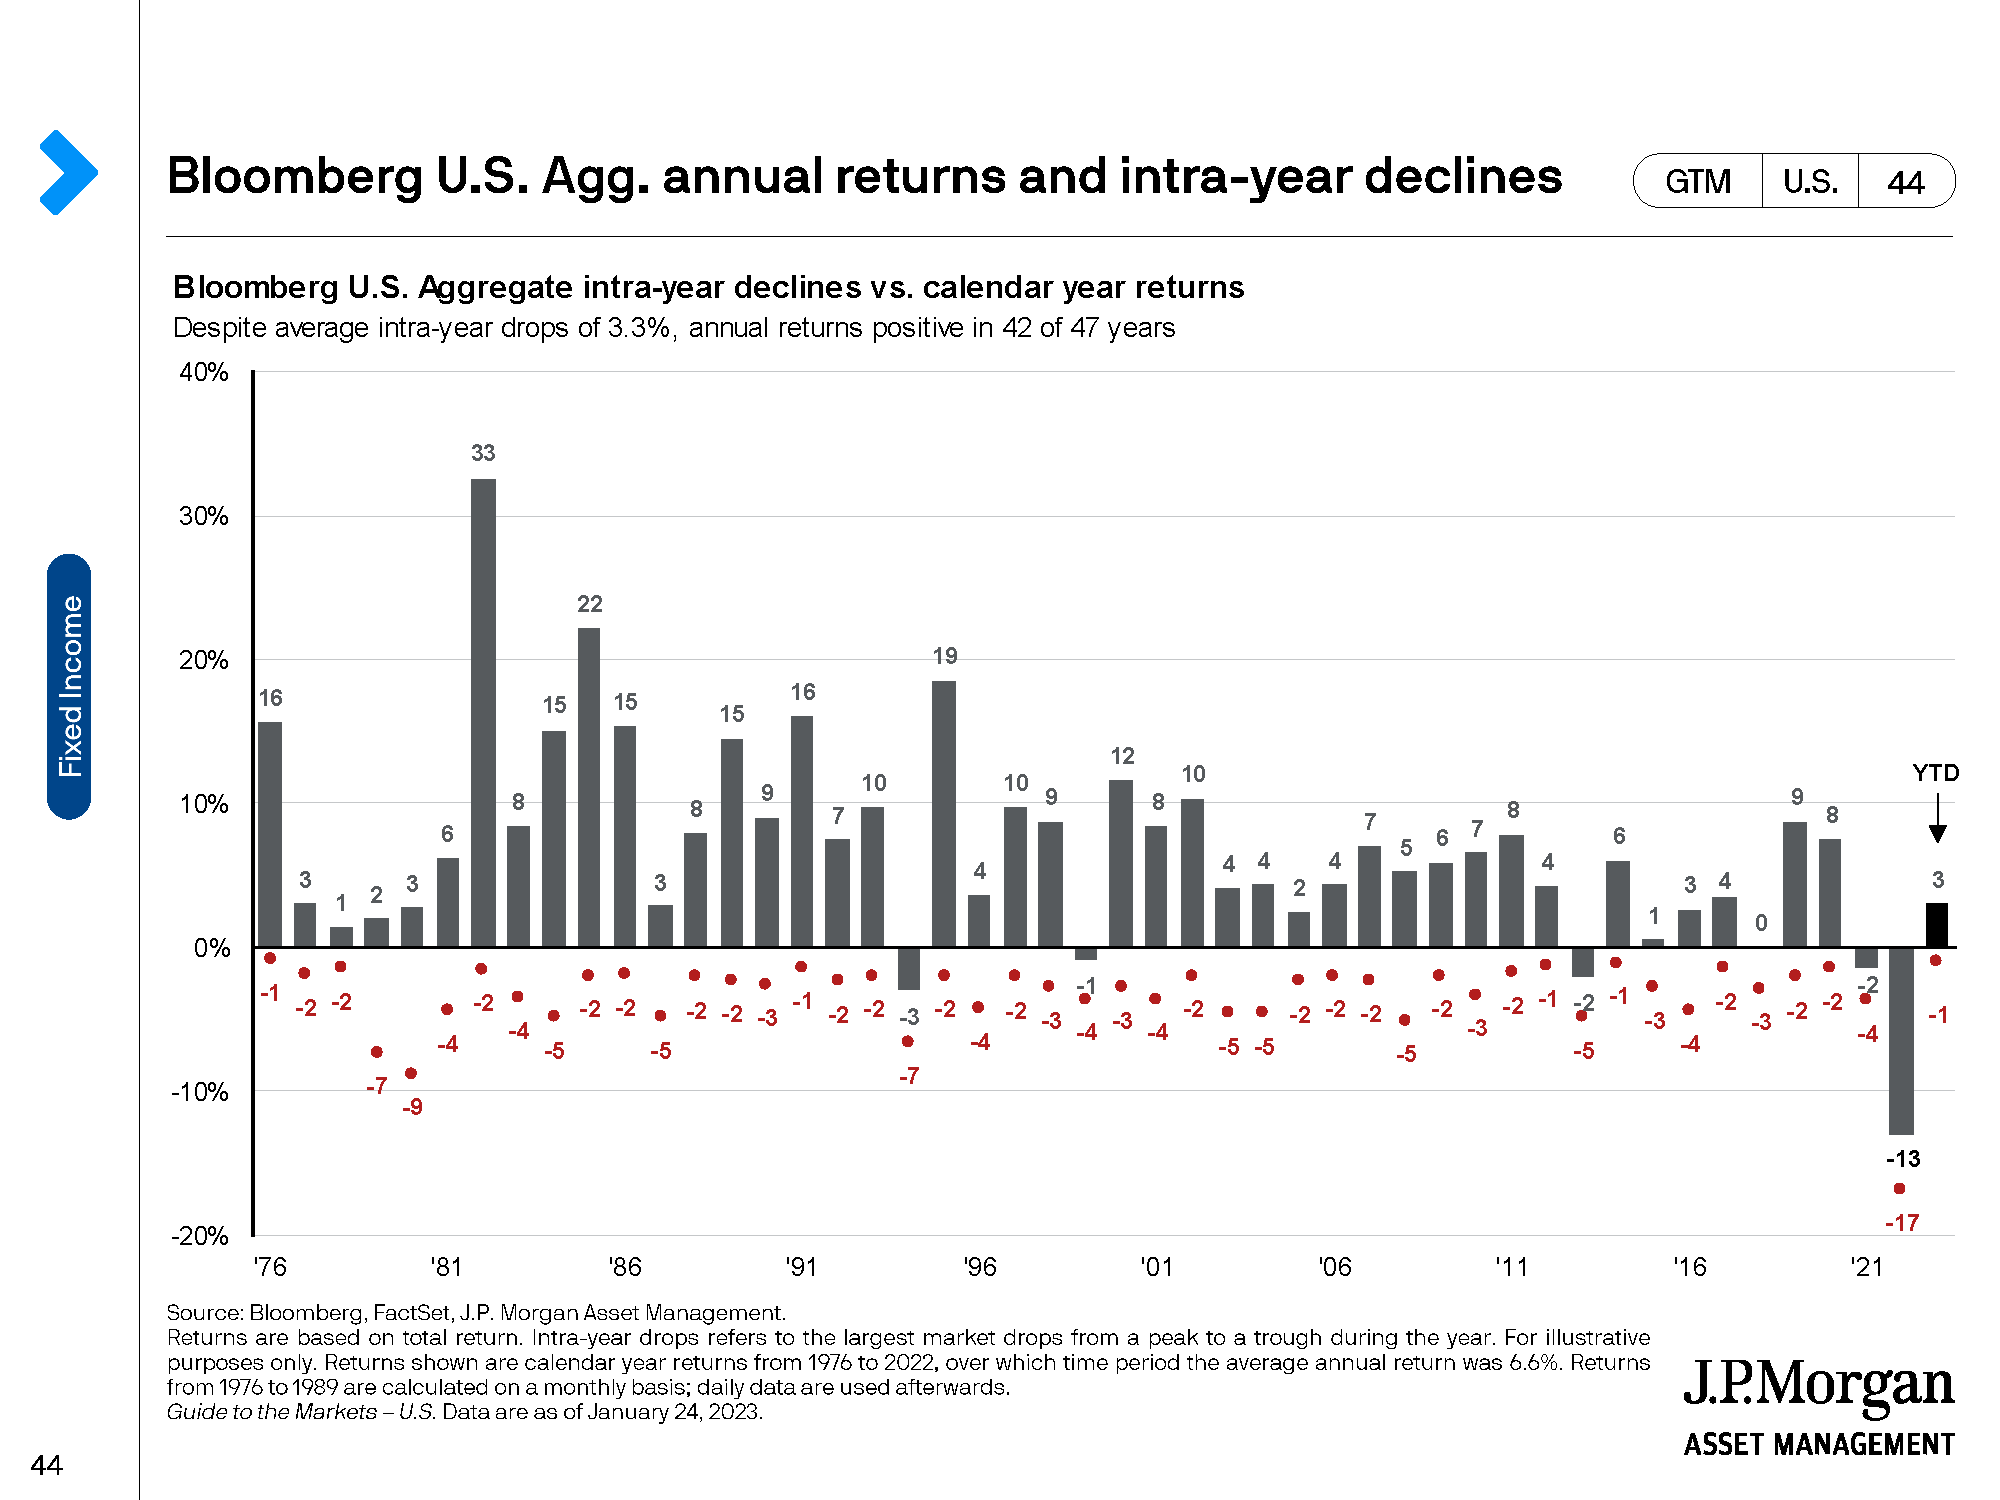
Slide 4 – Intra-Year Bond Market Volatility
Like stocks, bonds also experience intra-year drops, but historically they have provided a 6.6% average annual return over 47 years and were positive 89% of the time. 2022 was an outlier, with bonds down -17% at their lowest point and finishing the year down -13%. Bonds are generally less volatile and illustrate why a diversified portfolio of stocks and bonds helps reduce risk.
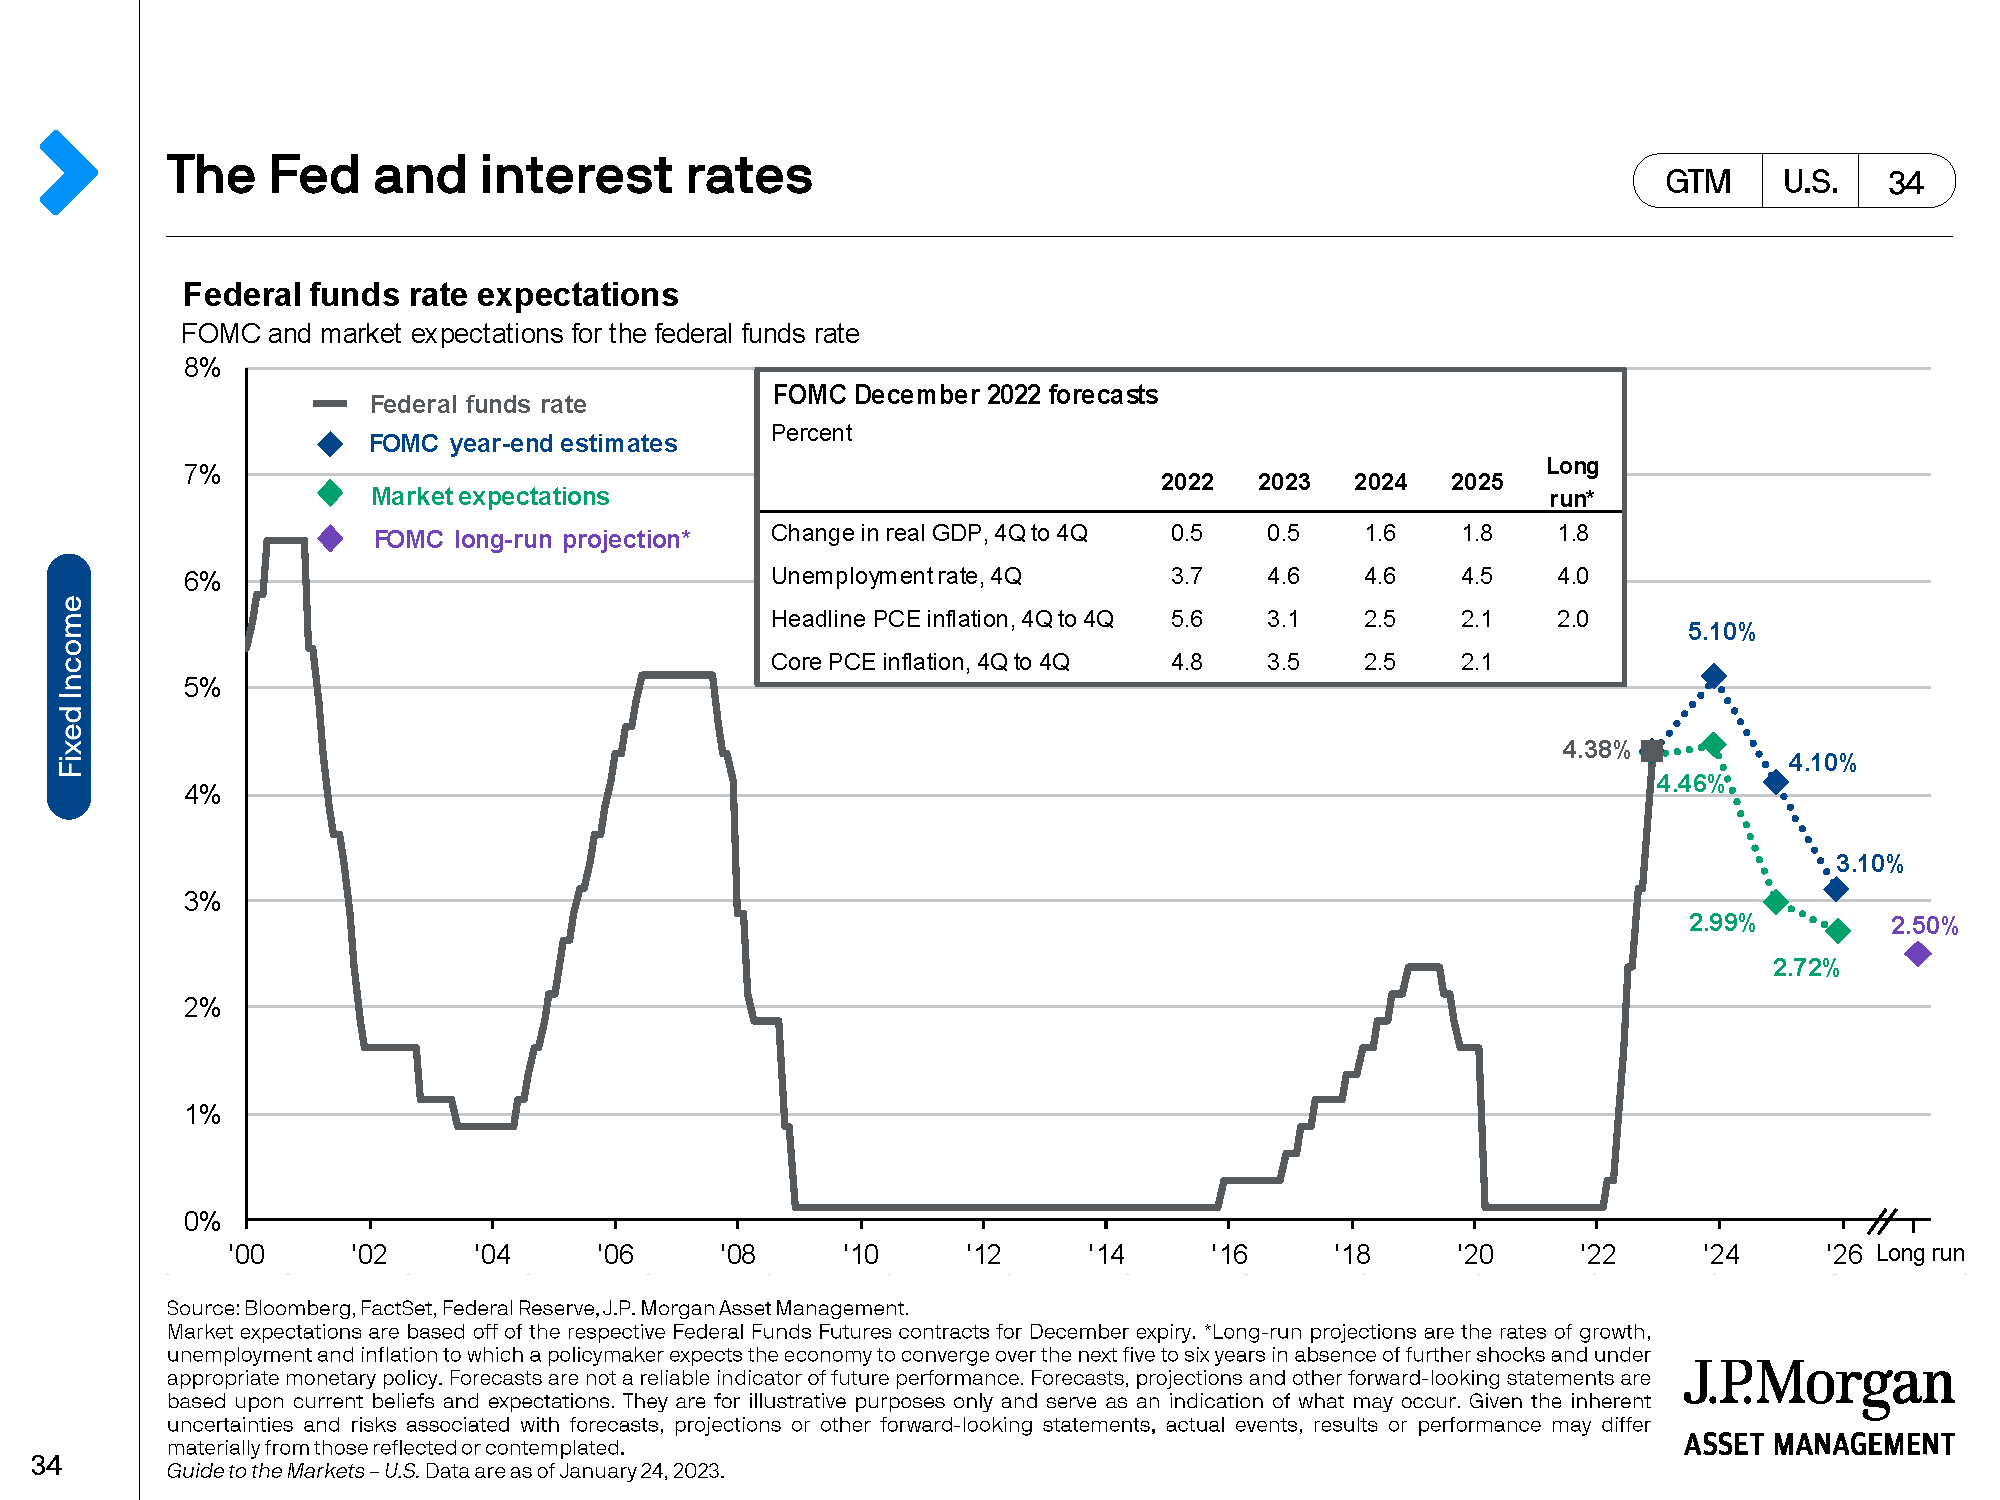
Slide 5 – Fed Interest Rate Expectations
This chart shows anticipated Fed interest rates. With inflation beginning to cool, the expectation is for slower, smaller rate hikes over the next 12 months. The Fed may start reducing rates in early 2024 once inflation shows sustained control.
Slide 6 – Blanket Chart
This chart emphasizes the benefits of a fully diversified portfolio across asset classes, sectors, and industries. Diversification helps reduce volatility while maintaining strong risk-adjusted returns.
Slide 7 – Market Volatility & Long-Term Perspective
The final slide highlights the importance of ignoring short-term headlines and fear-driven media. Volatility is normal for all investments, but it diminishes over time with diversification.
Short-term funds (1–3 years) should be in less volatile investments.
Longer-term goals can be invested more aggressively, as historically, 15–20 year periods since 1950 have always produced positive returns.
Overall Takeaway: Markets fluctuate, but history shows that staying invested with a diversified strategy is the most effective way to weather volatility and achieve long-term growth.
8:30 AM – 5:00 PM PST
Monday – Friday
Check the background of your financial professional on FINRA’s BrokerCheck.
Securities offered through Raymond James Financial Services, Inc. Member FINRA/SIPC. Investment advisory services are offered through Raymond James Financial Services Advisors, Inc. Constellation Wealth Services is not a registered broker dealer and is independent of Raymond James Financial Services.
Matthew Ross, 2025 Forbes Best-in-State Wealth Advisors
2025 Forbes Best-in-State Wealth Advisors. The Forbes Best-in-State Wealth Advisors 2025 ranking, developed by SHOOK Research, is based on an algorithm of qualitative criteria, mostly gained through telephone and in person due diligence interviews, and quantitative data. This ranking is based upon the period from 6/30/2023 to 6/30/2024 and was released on 4/8/2025. Those advisors that are considered have a minimum of seven years of experience, and the algorithm weighs factors like revenue trends, assets under management, compliance records, industry experience and those that encompass best practices in their practices and approach to working with clients. Portfolio performance is not a criteria due to varying client objectives and lack of audited data. Out of approximately 48,944 nominations, roughly 9,722 advisors received theaward. This ranking is not indicative of an advisor’s future performance, is not an endorsement, and may not be representative of individual clients’ experience. Neither Raymond James nor any of its Financial Advisors or RIA firms pay a fee in exchange for thisaward/rating. Compensation provided for using the rating. Raymond James is not affiliated with Forbes or Shook Research, LLC. Please visit https://www.forbes.com/best-in-state-wealth-advisors/ for more info.
Matthew Ross has been named 2024 Forbes Best-In-State Wealth Advisors, developed by Shook Research, is based on the period from 6/30/2022 to 6/30/2023 and was released on 4/3/2024. 42,108 nominations were received, and 8,500 advisors won. Neither Raymond James nor any of its advisors pay a fee in exchange for this award. More: https://bit.ly/43DMgjX. Please see https://www.forbes.com/best-in-state-wealth-advisors for more info.
Matthew Ross, 2023 AdvisorHub 200 Fast Growing Advisors to Watch
The 2023 AdvisorHub 200 Fast Growing Advisors to Watch ranking is based on an algorithm of criteria, focused on three key areas: Quality of Practice, Year-Over-Year Growth, and Professionalism & Character. The rankings weigh the scores in Quality and Growth more heavily than other areas. Time period upon which the rating is based is from 1/1/2021 to 12/31/2022 and was released on 6/20/2023. Advisors considered have a minimum of seven years’ experience, a clean regulatory record with 2 or fewer complaints and no significant judgements, must have been with their current firm for at least two years and in good standing, and have at least $100 million in assets under management. Out of 1,246 total nominations received, 200 advisors received the award. This ranking is not based in any way on the individual’s abilities regarding providing investment advice or management. This ranking is not indicative of advisor’s future performance, is not an endorsement, and may not be representative of individual clients’ experience. Neither Raymond James nor any of its Financial Advisors or RIA firms pay a fee in exchange for this award/rating. Raymond James is not affiliated with AdvisorHub.
Raymond James financial advisors may only conduct business with residents of the states and/or jurisdictions for which they are properly registered. Therefore, a response to a request for information may be delayed. Please note that not all of the investments and services mentioned are available in every state. Investors outside of the United States are subject to securities and tax regulations within their applicable jurisdictions that are not addressed on this site. Contact your local Raymond James office for information and availability.
Links are being provided for information purposes only. Raymond James is not affiliated with and does not endorse, authorize or sponsor any of the listed websites or their respective sponsors. Raymond James is not responsible for the content of any website or the collection or use of information regarding any website’s users and/or members.
Matthew Ross, Raymond James Financial Services Chairman’s Council
Membership is based on prior fiscal year production. Requalification is required annually. The ranking may not be representative of any one client’s experience, is not an endorsement, and is not indicative of an advisor’s future performance. No fee is paid in exchange for this award/rating. Investment products are: not deposits, not FDIC/NCUA insured, not insured by any government agency, not bank guaranteed, subject to risk and may lose value. © 2023 Raymond James Financial Services, Inc., member FINRA/ SIPC. Securities offered through Raymond James Financial Services, Inc., member FINRA/SIPC. Investment advisory services offered through Raymond James Financial Services Advisors, Inc.
© 2024 Securities offered through Raymond James Financial Services, Inc., member FINRA · SIPC · Privacy Policy · Legal Policy