
To kick off the new year, we’re excited to welcome special guest Justin Sidhu from J.P. Morgan for a Guide to the Markets session on January 25th at 4 PM Pacific via Zoom.
After a year like 2022, we know many of you have questions about what’s ahead—both the opportunities and challenges. Justin represents a company deeply rooted in economic research and market analysis, and he’ll be sharing timely insights that you won’t want to miss.
About our speaker:
Justin Sidhu is an Executive Director and Client Advisor at J.P. Morgan Asset Management. Since joining in 2005, he has worked in the independent broker-dealer channel, focusing on mutual fund and ETF sales in the Pacific Northwest. His expertise and extensive resources help support our team and clients at Ross Financial.
Join us for this insightful discussion!
Slide 1 – Cover Slide
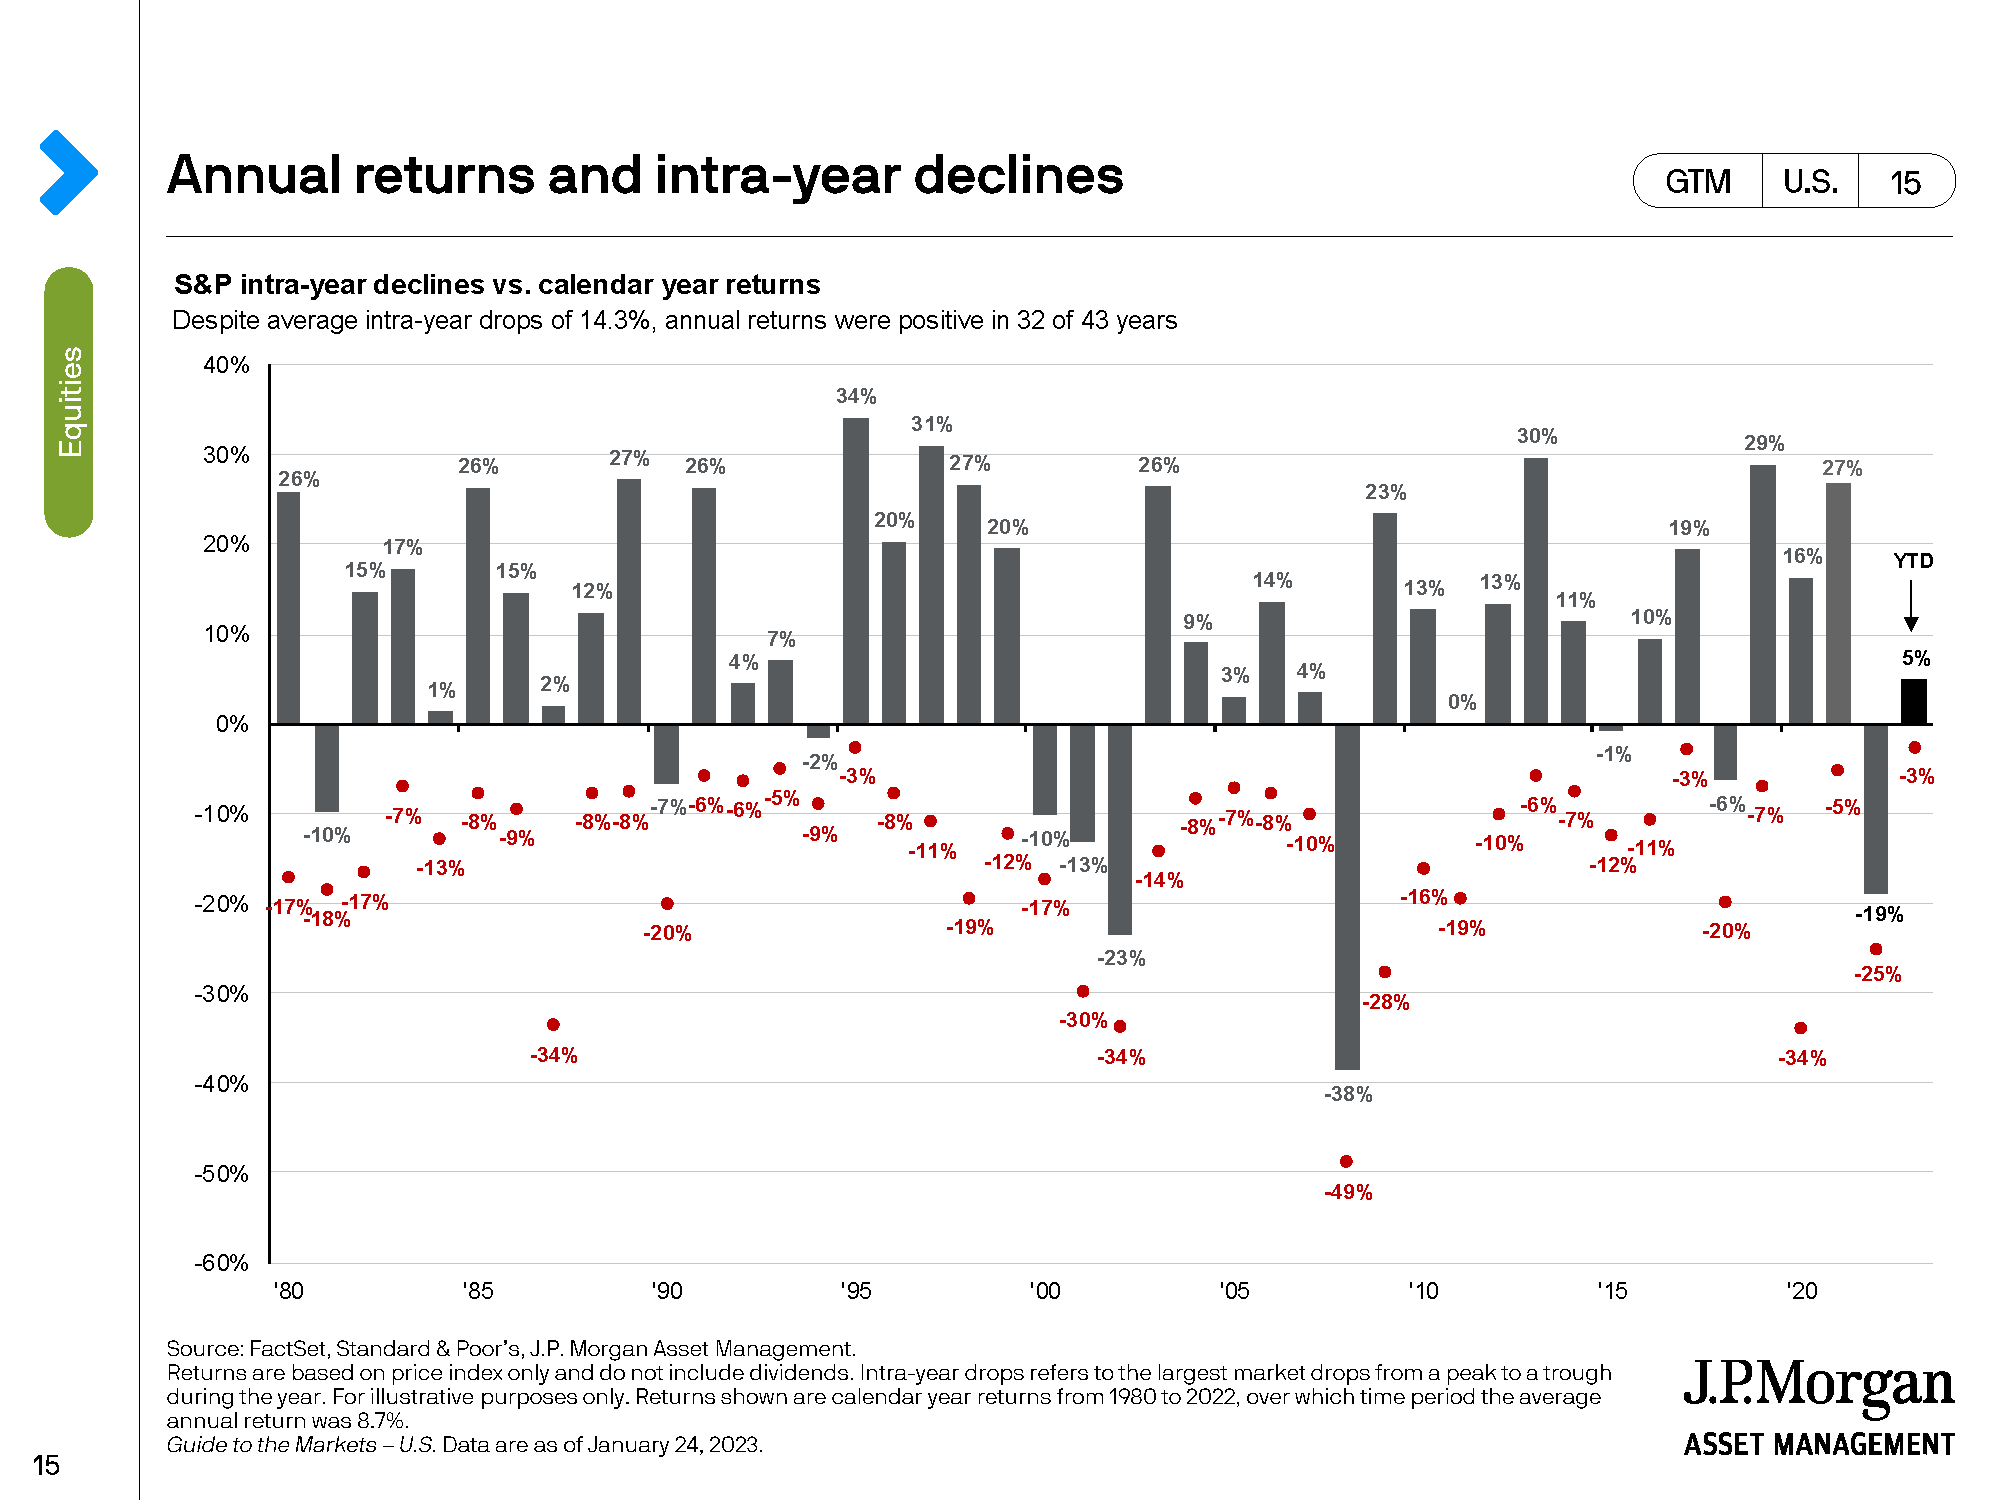
The key takeaway: every year, the market experiences an average decline of about -15%, regardless of whether the year ends positive or negative. This is normal market behavior, and historically, the market has recovered and delivered positive returns 75% of the time, with an average annual return of 8.7% over the last 42 years.
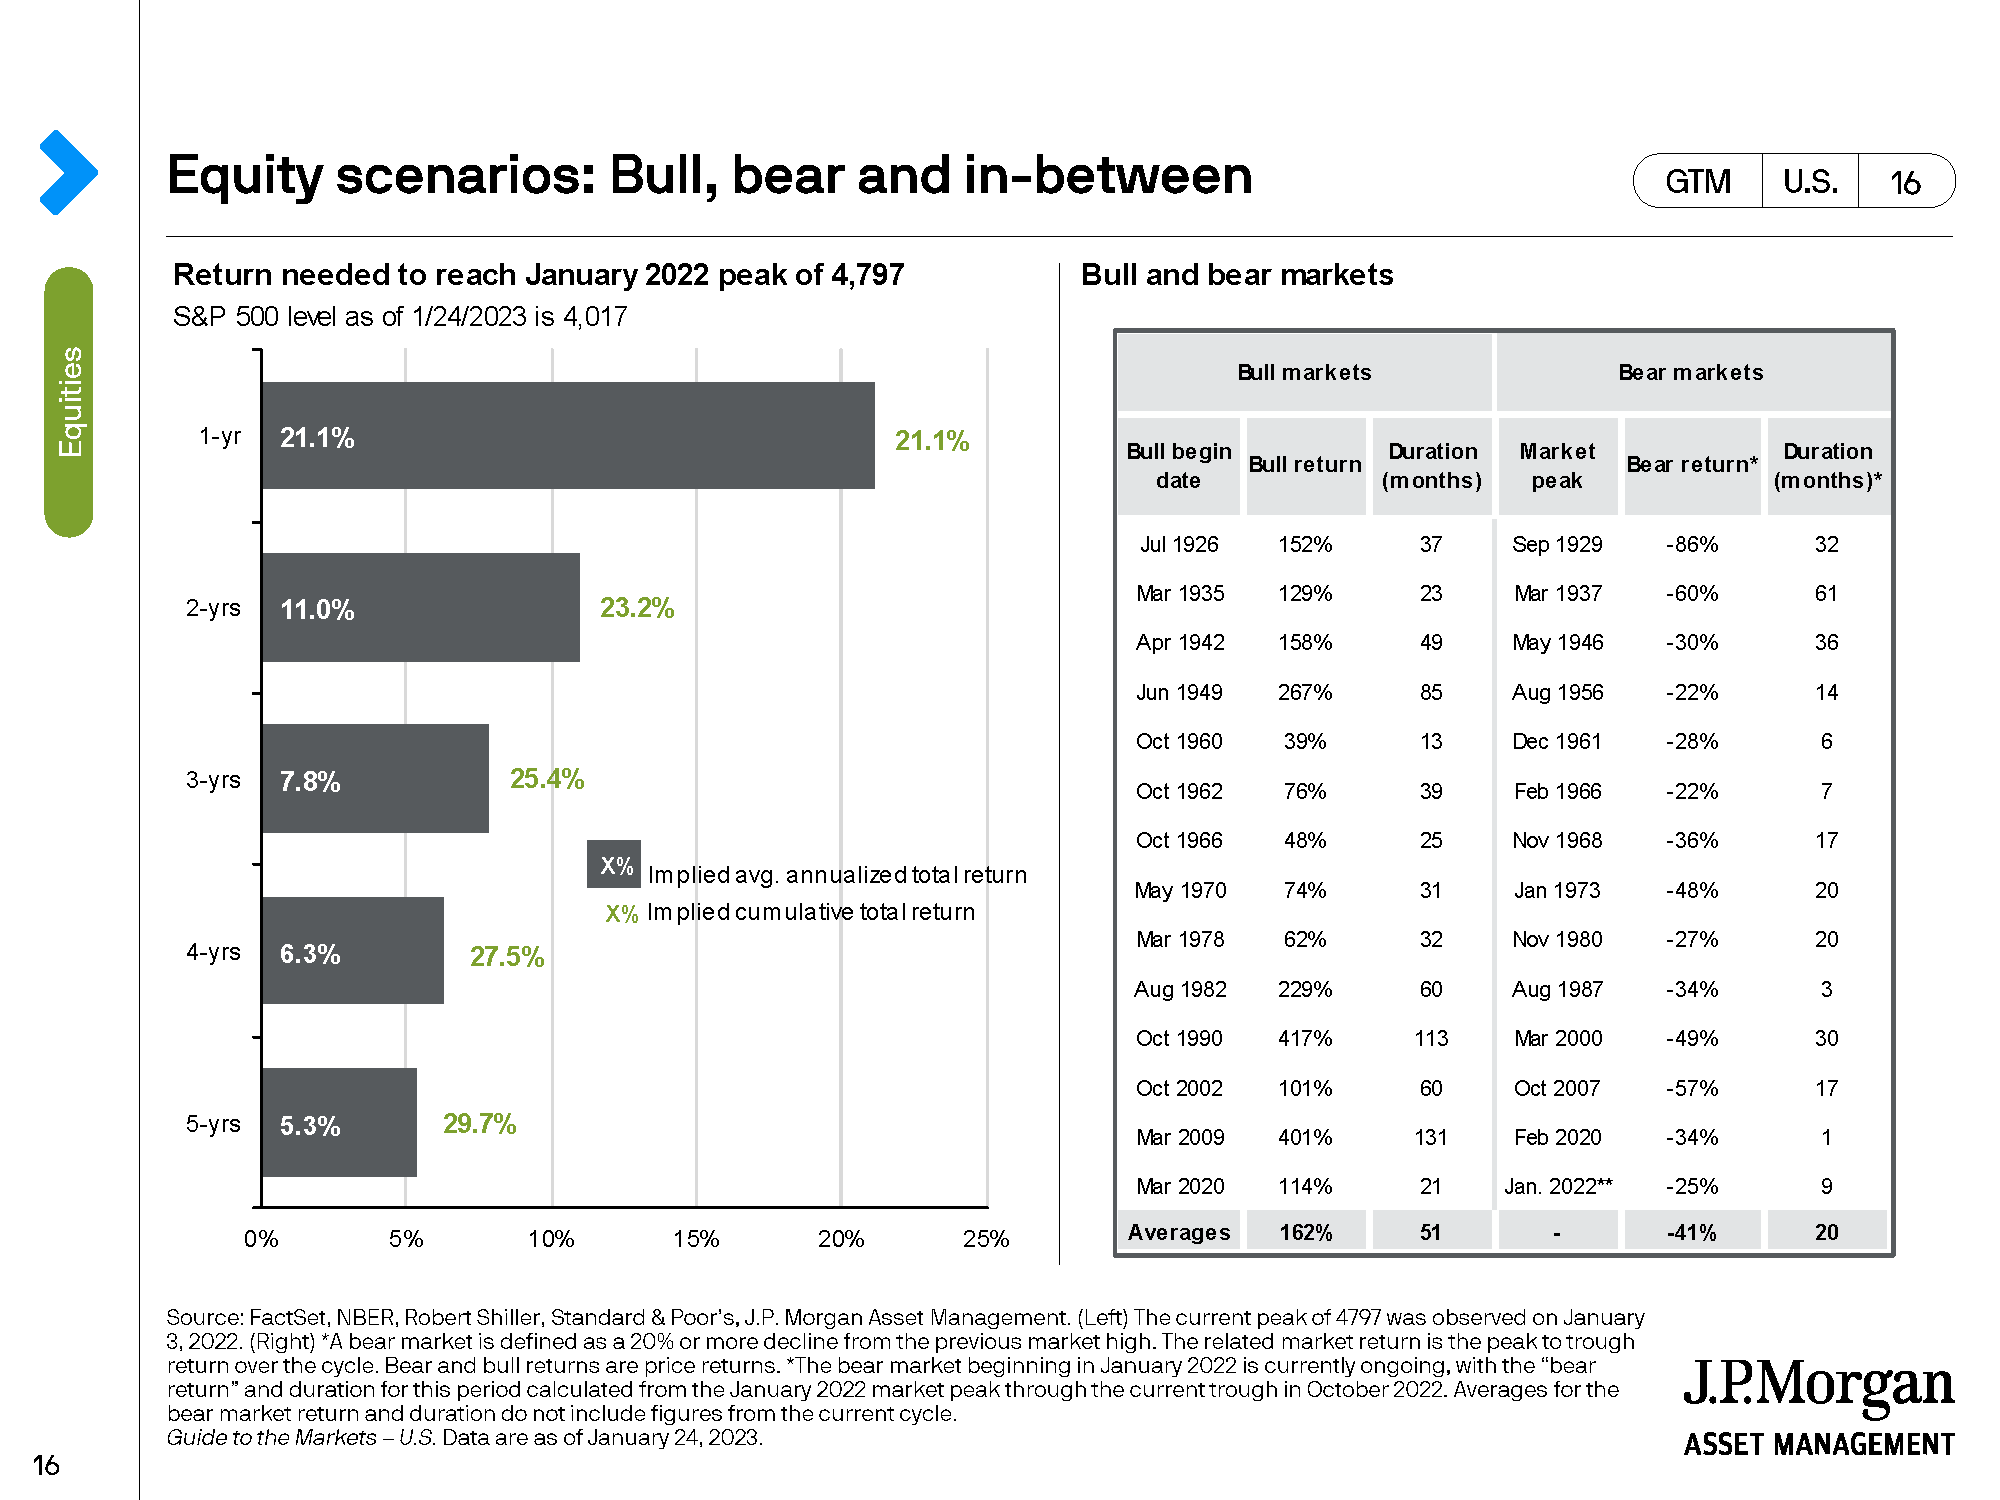
Slide 2 – Expected Recovery from 2022
On the left, we see that based on expected returns, we can anticipate how long it might take for the market to recover from last year’s negative performance. This illustrates why moving entirely to safety isn’t recommended—future growth is needed to recover prior losses. On the right, historical bull and bear markets show that average bull markets outperform bear markets, emphasizing the importance of staying invested.
Slide 3 – Intra-Year Stock Market Volatility
This slide depicts intra-year volatility in the stock market, showing that short-term declines are normal and expected. Understanding this helps investors avoid overreacting to temporary drops.
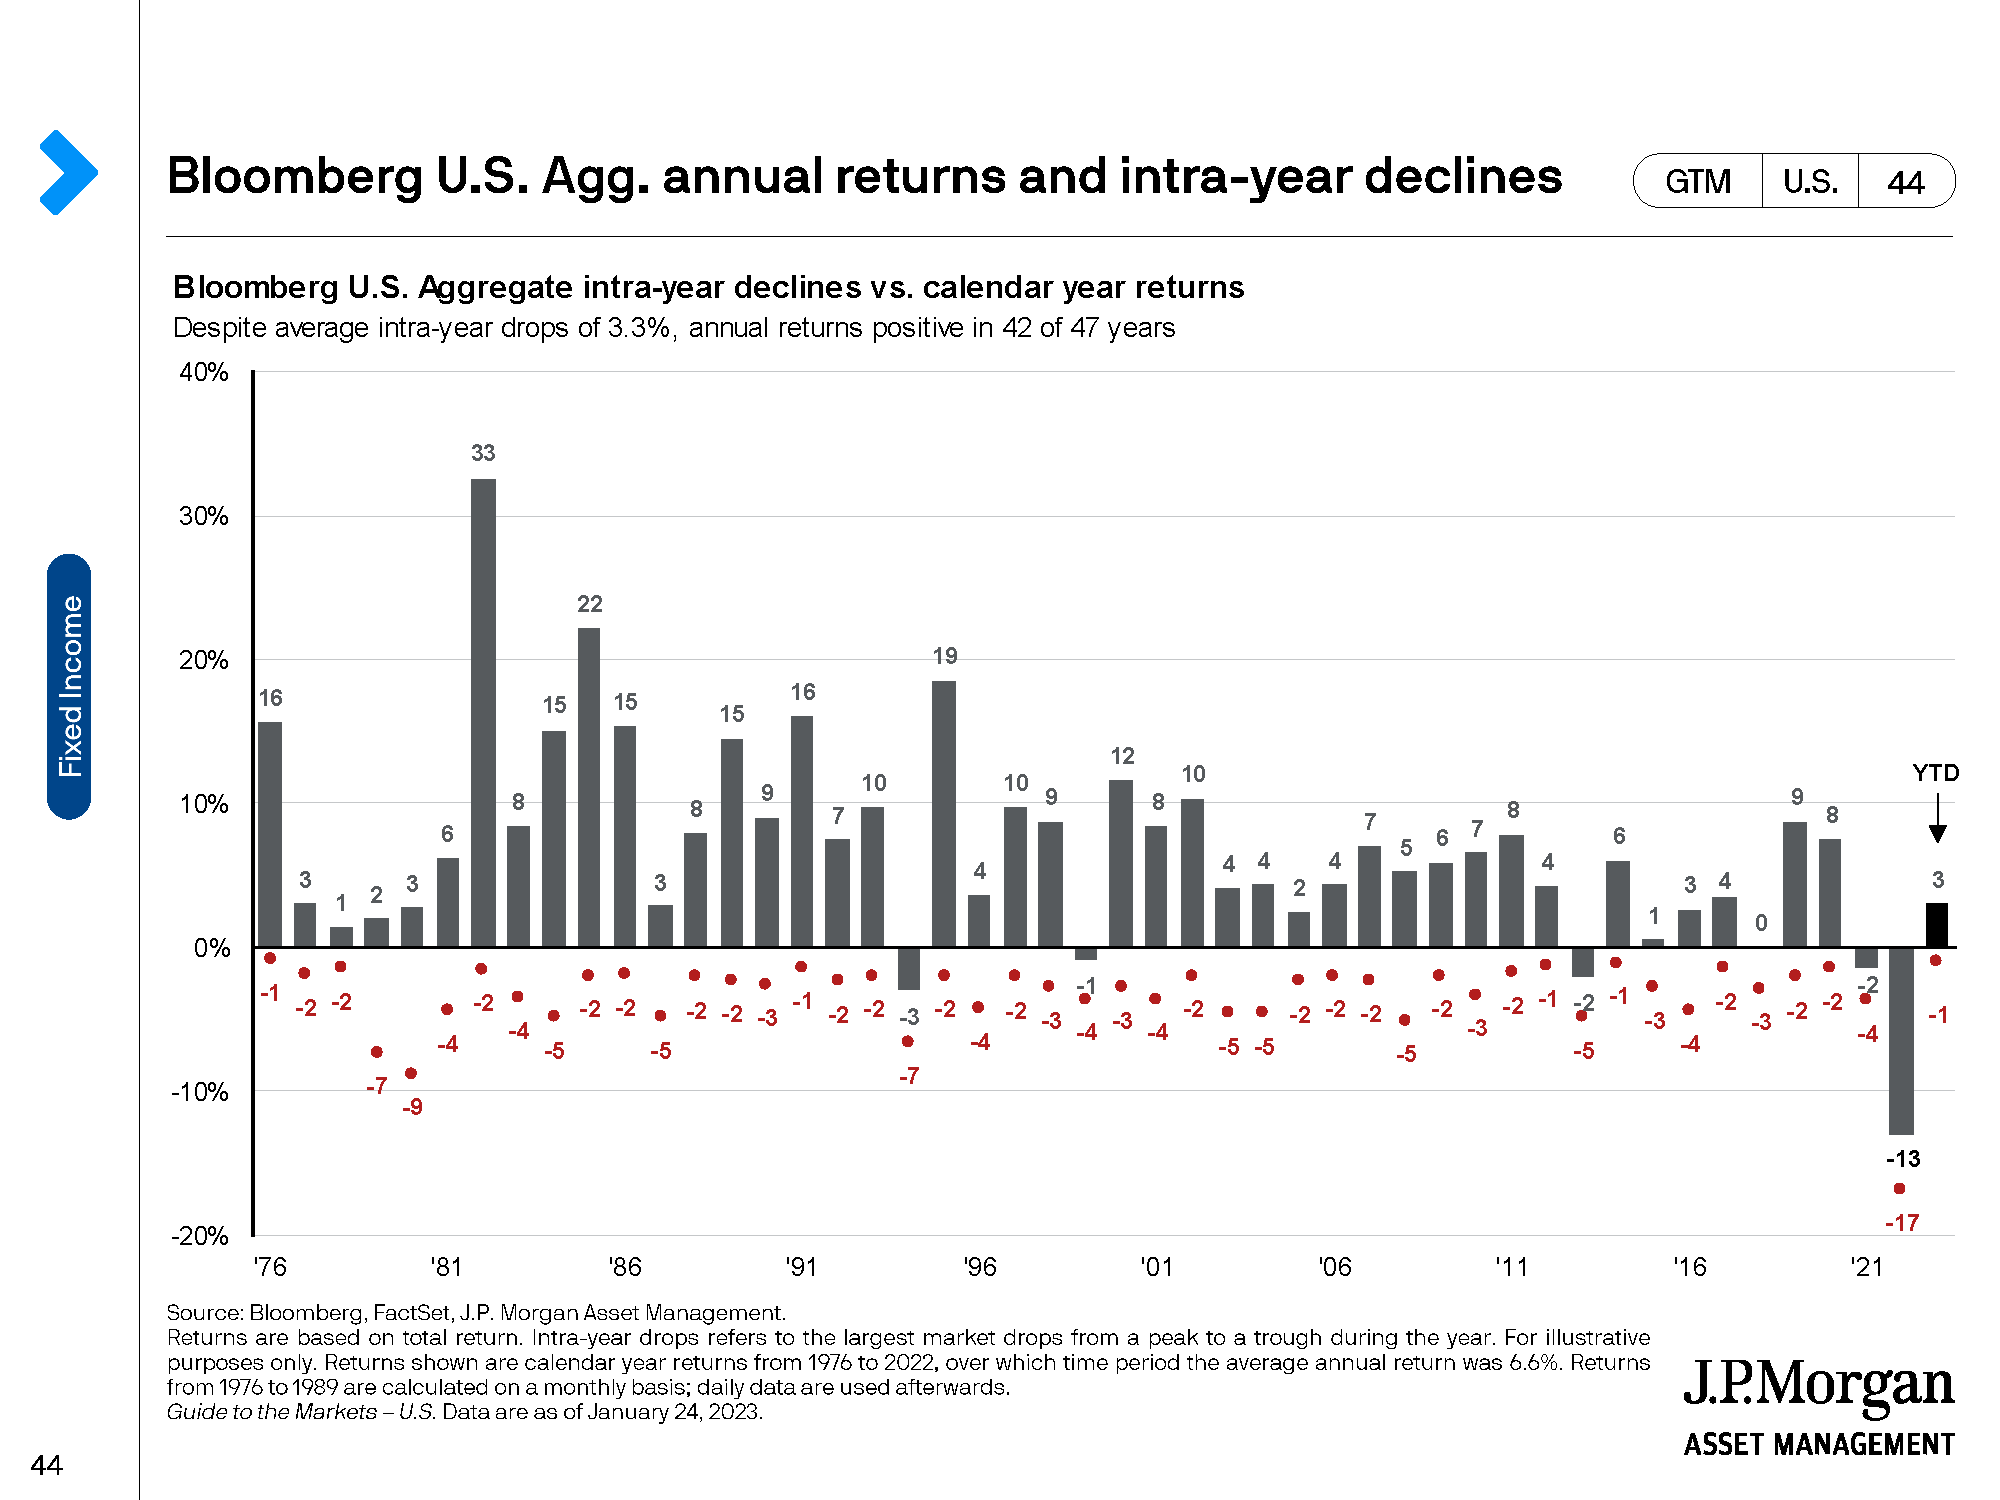
Slide 4 – Intra-Year Bond Market Volatility
Like stocks, bonds also experience intra-year drops, but historically they have provided a 6.6% average annual return over 47 years and were positive 89% of the time. 2022 was an outlier, with bonds down -17% at their lowest point and finishing the year down -13%. Bonds are generally less volatile and illustrate why a diversified portfolio of stocks and bonds helps reduce risk.
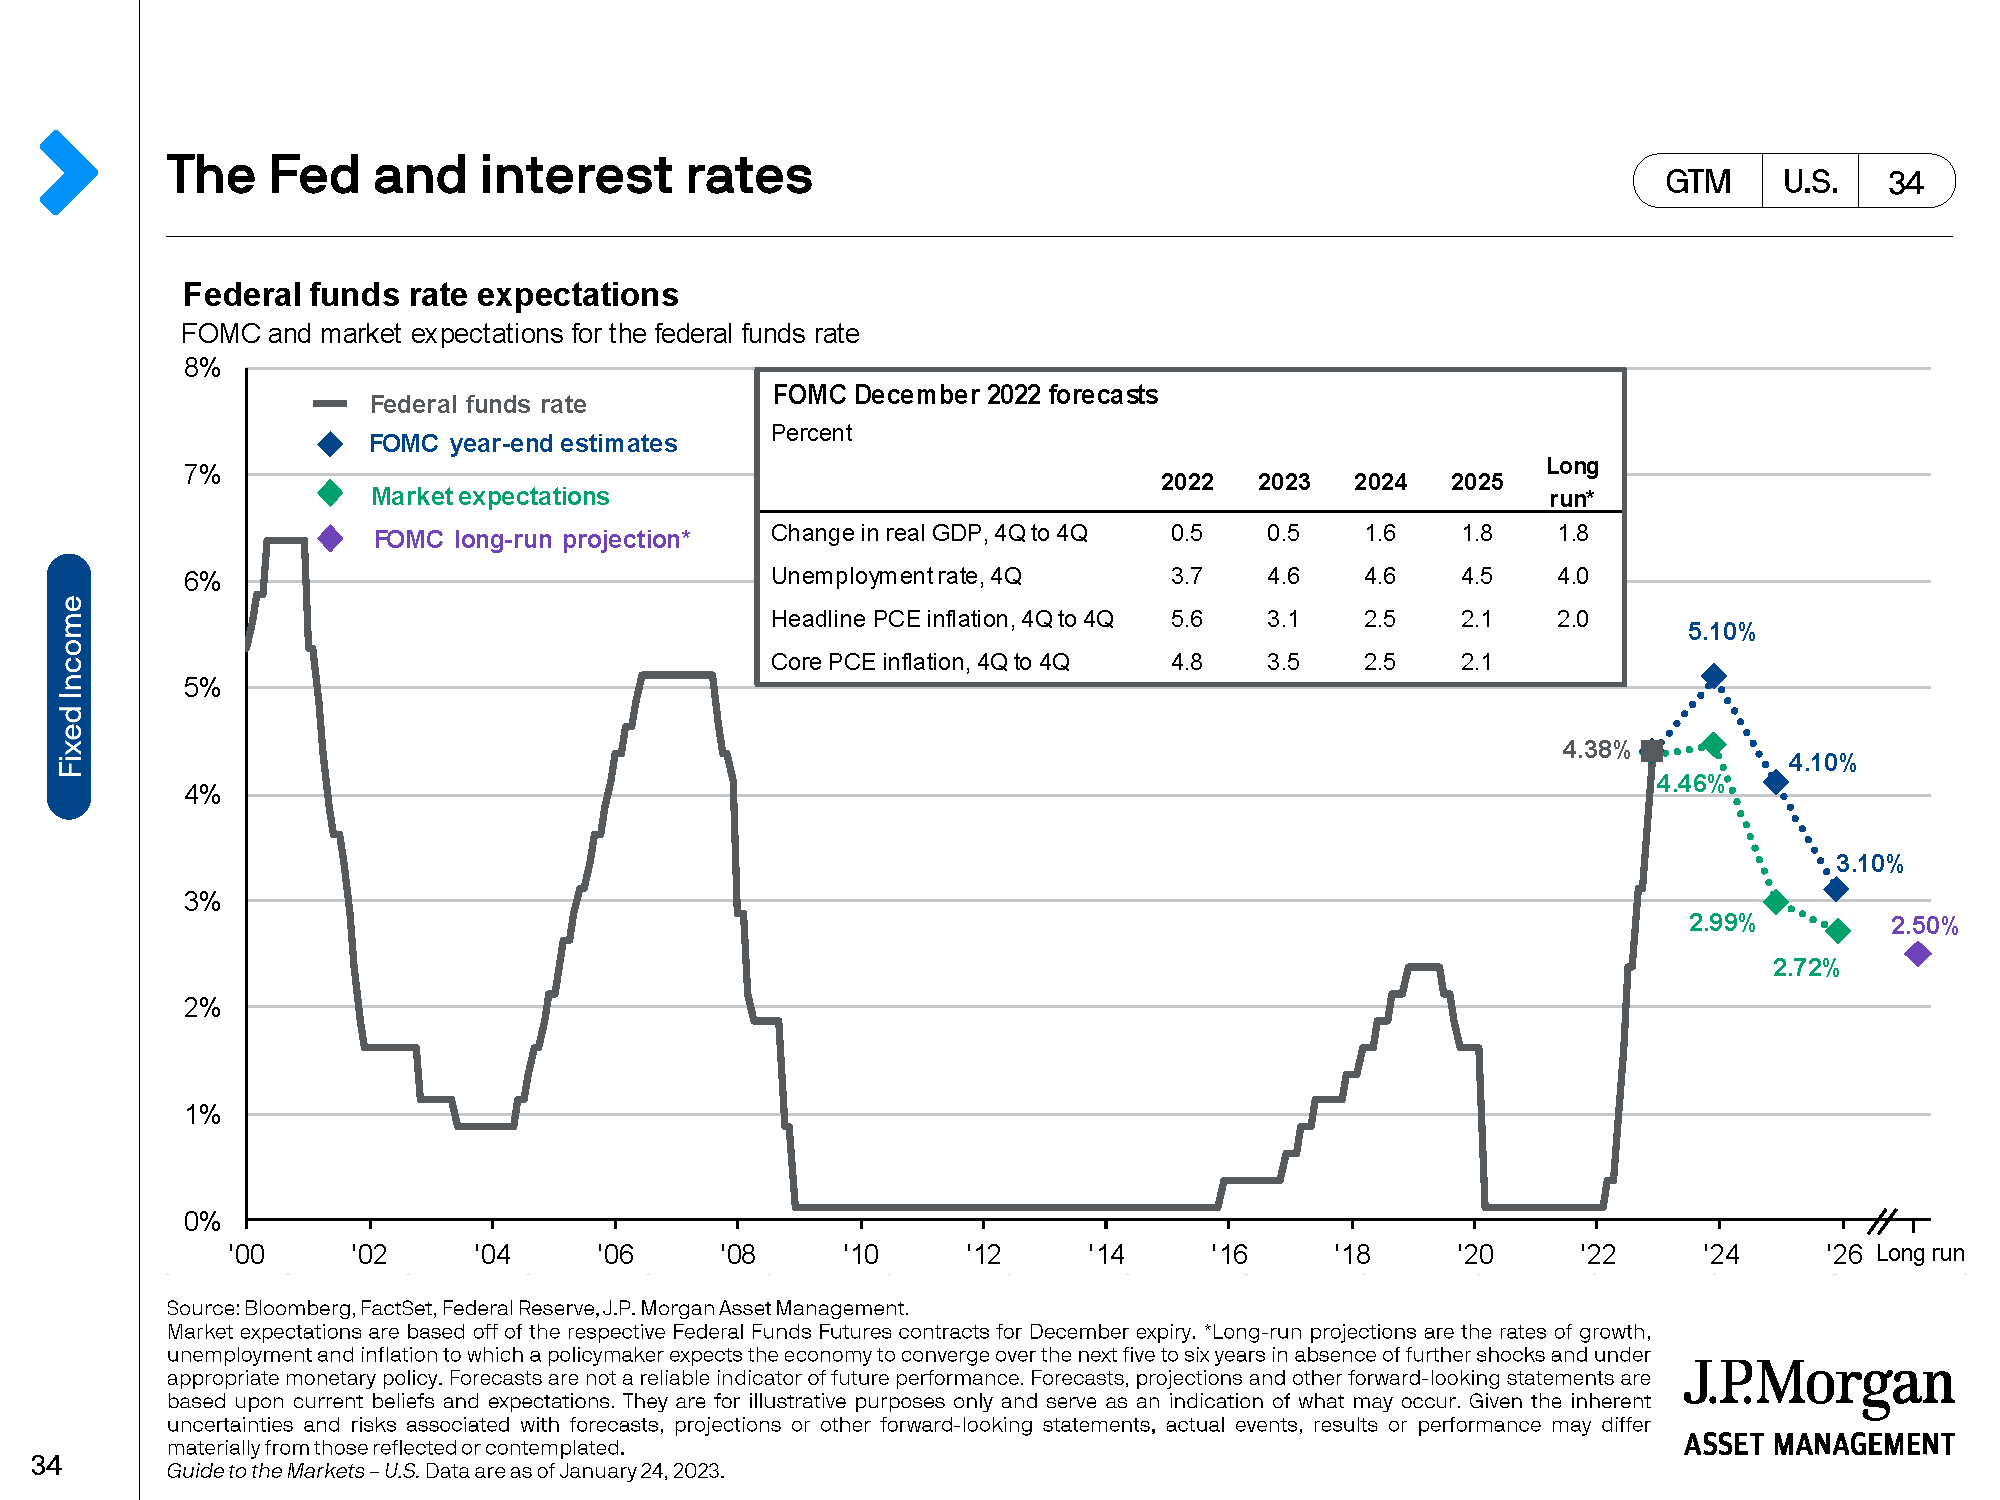
Slide 5 – Fed Interest Rate Expectations
This chart shows anticipated Fed interest rates. With inflation beginning to cool, the expectation is for slower, smaller rate hikes over the next 12 months. The Fed may start reducing rates in early 2024 once inflation shows sustained control.
Slide 6 – Blanket Chart
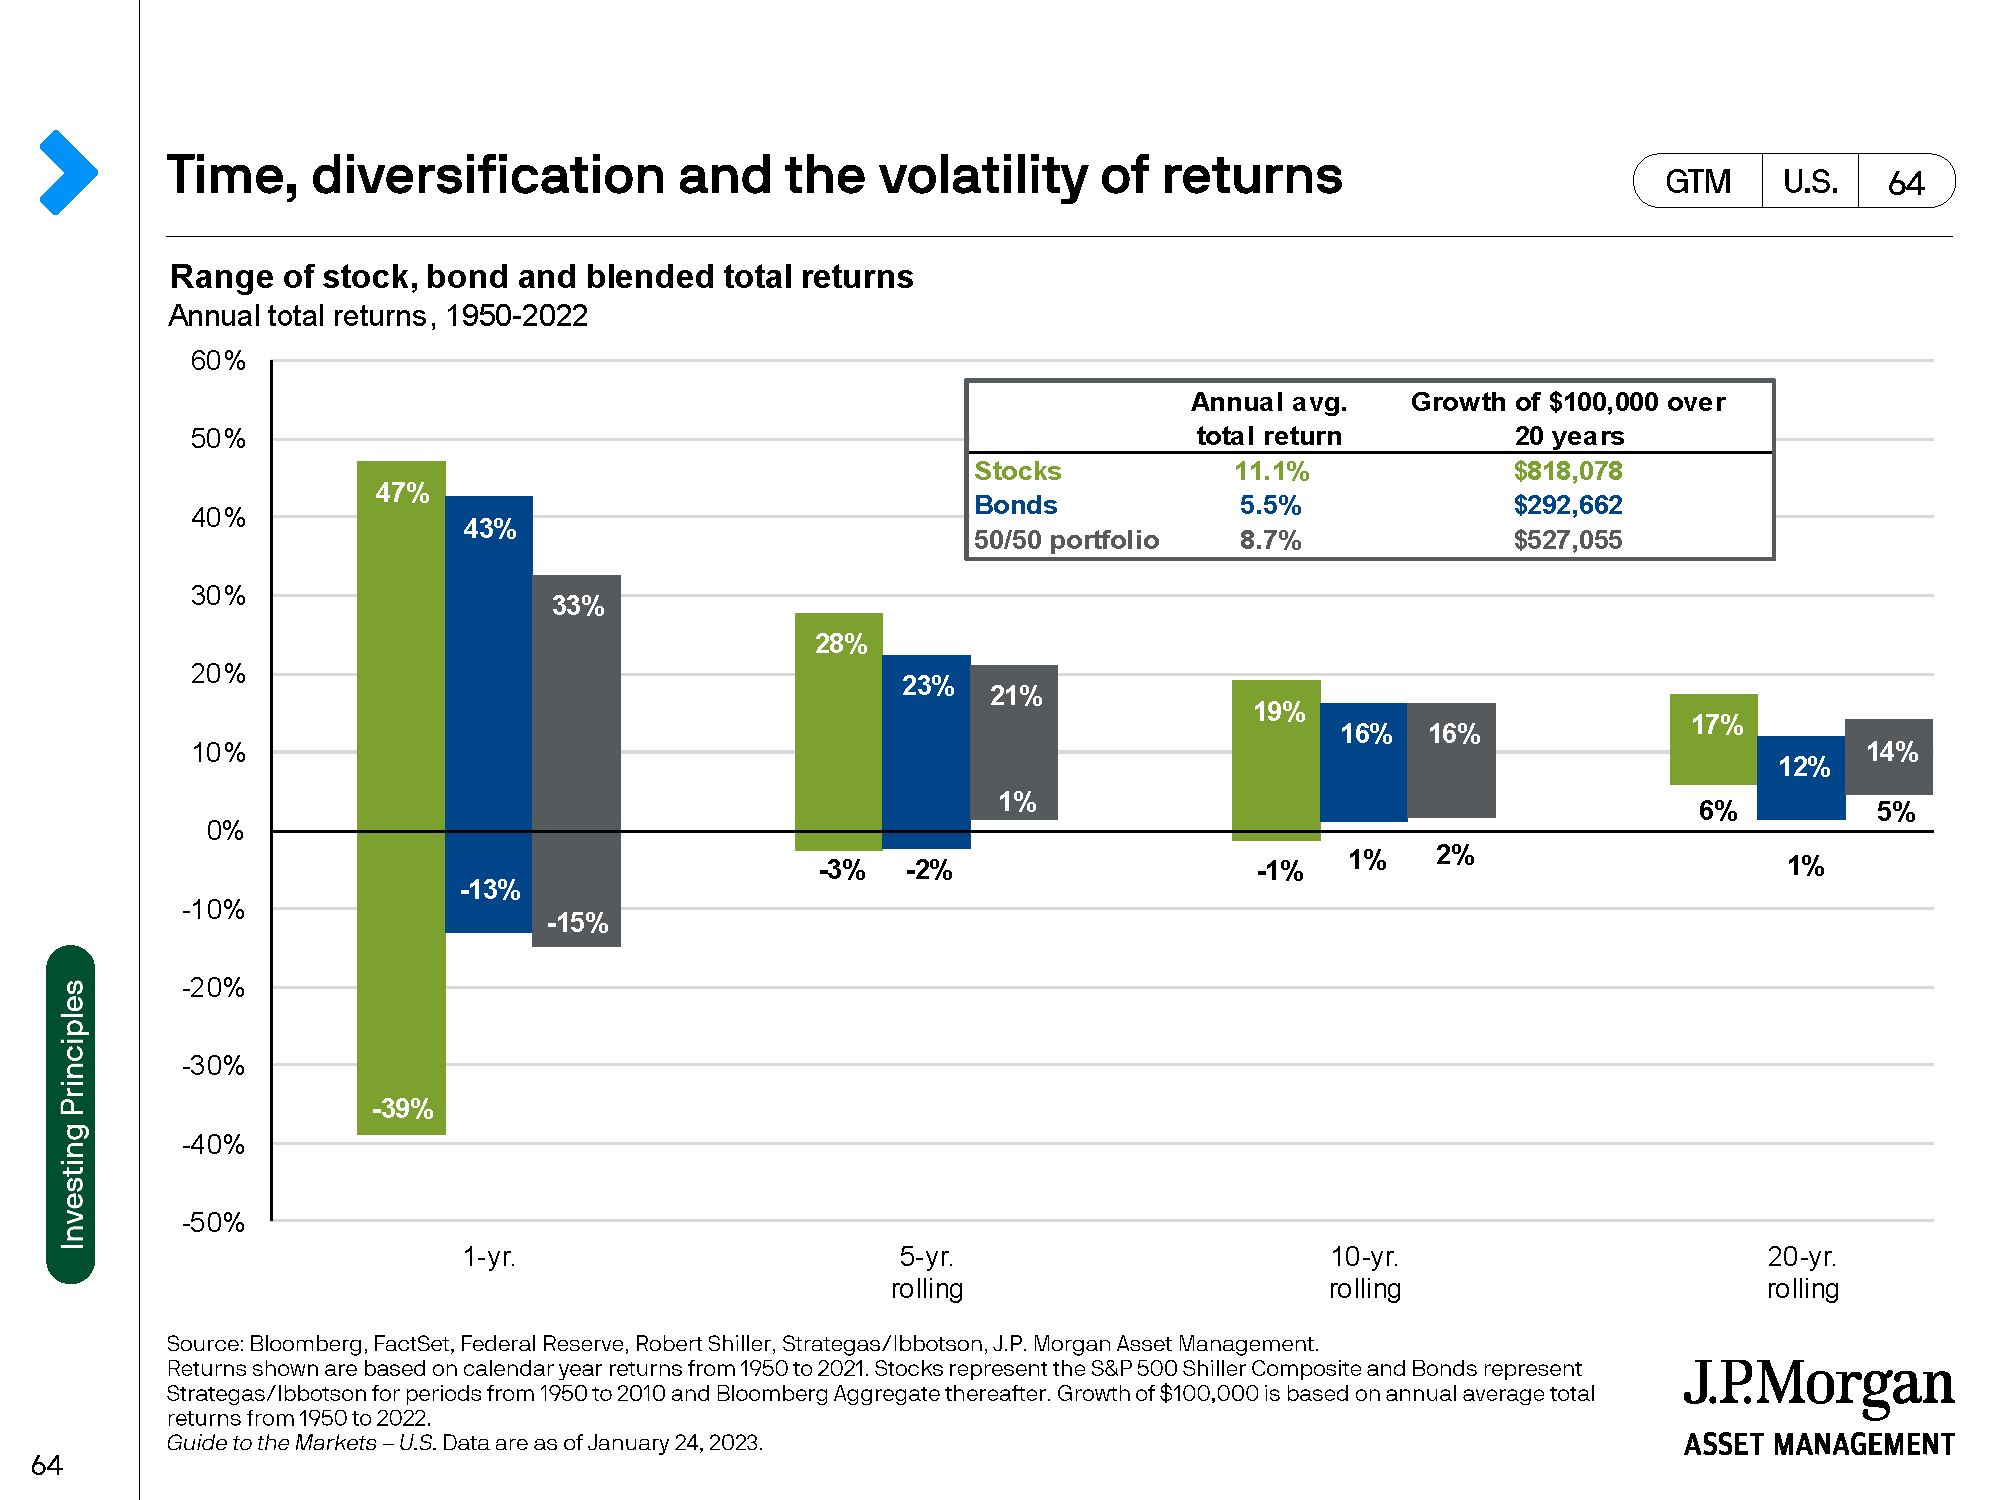
This chart emphasizes the benefits of a fully diversified portfolio across asset classes, sectors, and industries. Diversification helps reduce volatility while maintaining strong risk-adjusted returns.
Slide 7 – Market Volatility & Long-Term Perspective
The final slide highlights the importance of ignoring short-term headlines and fear-driven media. Volatility is normal for all investments, but it diminishes over time with diversification.
Short-term funds (1–3 years) should be in less volatile investments.
Longer-term goals can be invested more aggressively, as historically, 15–20 year periods since 1950 have always produced positive returns.
Overall Takeaway: Markets fluctuate, but history shows that staying invested with a diversified strategy is the most effective way to weather volatility and achieve long-term growth.